With the easing in the consumer price inflation rate in recent months hopefully indicating that the interest rate hiking cycle is at an end, despite this month’s (Sept) fuel hike, market sentiment in South Africa’s housing market remains positive, as indicated in the Pam Golding Residential Property Index, by the ongoing recovery which rose to 4.1% in July (2023), says Dr Andrew Golding, chief executive of the Pam Golding Property group.
Says Dr Golding: “Fuelled by buyer demand, the rebound in national house price inflation (HPI) continues to gather momentum, rising from a cyclical low of 3.7% in January 2023 to 4.1% in July. It also compares favourably with the national average of 3.89% for HPI during the first seven months of 2023.
“Coupled with this, the demand for sectional title residential property remains on an upward trajectory, with growth in sectional title property prices exceeding freehold HPI for the second consecutive month – a trend last seen in 2004.”
As reported by Lightstone, sectional title HPI rose by +2.7% in July, compared with growth of +2.3% in freehold house prices. Notably, the coastal price premium continues to widen, averaging 4.55% in the year to April 2023 (latest available data), compared to an average of 3.63% last year (2022).
Says Dr Golding: “Of further interest to home buyers seeking credit is that the gap between approval rates for mortgage finance applications linked to pre-qualification (89.8%) versus those not pre-qualified (79.2%) rose to its highest level in more than a year in July, according to ooba statistics.
“Overall, the Western Cape has registered the strongest growth in house prices during the seven months of the year at 5.15%, considerably exceeding the national average of 3.89% for the same period. Furthermore, in terms of value , the Western Cape accounts for a growing percentage of total building plans passed, having overtaken Gauteng for the first time on record in 2022.”
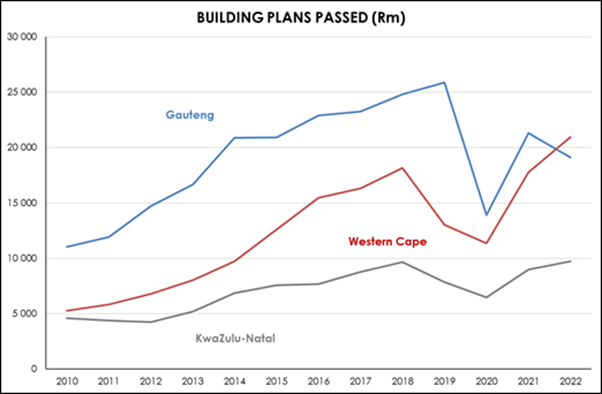
SOURCE: Statistics SA
Although the City of Cape Town accounts for the largest percentage (ie volume ) of building plans passed within the Western Cape, its portion of the total for the province is declining. After peaking at over 72% of all Western Cape plans passed (by value) between 2013 and 2016, the percentage began declining in 2017 and had fallen to just 44.3% of total Western Cape plans passed by last year.
Rebound in building plans in major metro markets
Says Dr Golding: “When reviewing the total number of plans passed, all major metro markets have experienced a rebound in activity from the pandemic-induced slowdown – with the exception of Johannesburg, where the number of plans continues to decline. Notably, Nelson Mandela Bay and eThekwini have seen the number of plans passed recover beyond pre-Covid levels.
“A similar picture emerges when looking at the value of plans passed. Nelson Mandela Bay and eThekwini have rebounded beyond 2019 levels while the other metros – except for Johannesburg – have recovered, but have yet to regain pre-Covid levels.
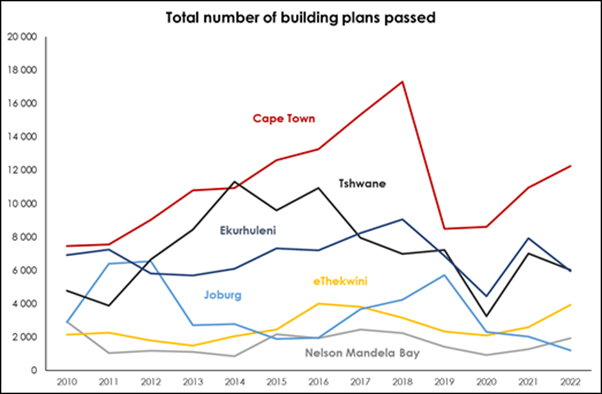
SOURCE: Statistics SA
“Interestingly, while the Western Cape overall exceeds Gauteng in terms of the value of building plans passed in 2022, at a metro level, Tshwane registered a higher value of building plans passed than Cape Town in both 2021 and 2022. This suggests that a growing percentage of building plans passed in the Western Cape is occurring in areas outside the metro market – such as in the Boland, Overberg and towns along the Garden Route, while in Gauteng, the rebound in building plans passed in Tshwane is being at least partially offset by a decline in the value of plans elsewhere, such as in Johannesburg.”
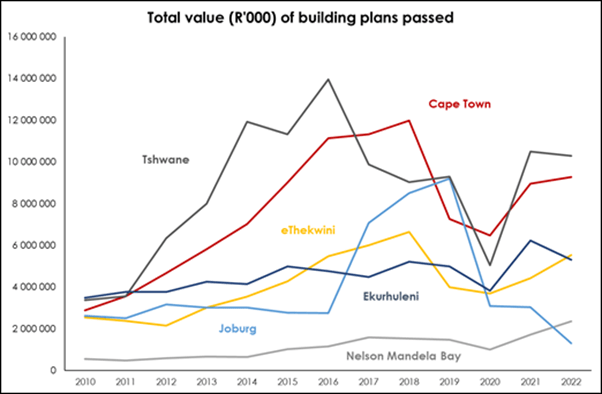
SOURCE: Statistics SA
Adds Dr Golding: “In Gauteng, and not surprisingly, during Covid, all three metros registered a decline in the value of building plans passed. Positively, however, Tshwane rebounded strongly thereafter, with the value of plans passed in both 2020 and 2021 higher than in 2019 – although that presumably is attributable to significantly higher building costs. Ekurhuleni also experienced a rebound, with 2021 and 2022 values higher than any other year in the past decade.
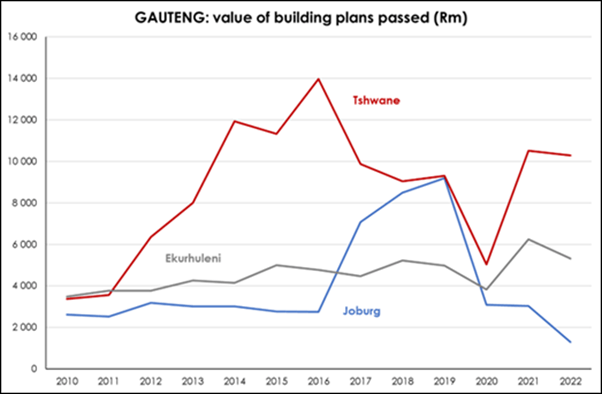
“Other than in 2010 and 2011, Tshwane has consistently registered the highest value of building plans passed among Gauteng’s three major metros, which may suggest more expensive homes being built there.
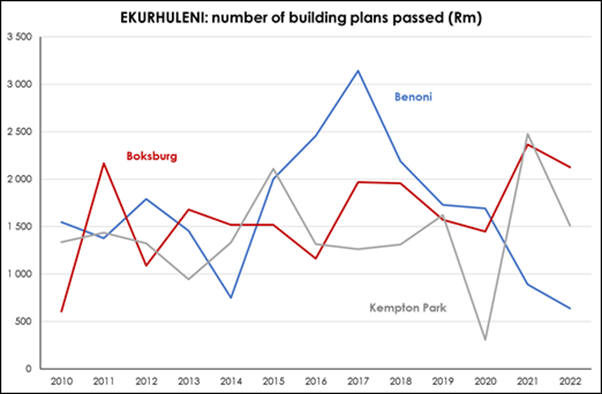
“In Ekurhuleni, between 2015 and 2020 Benoni experienced the most activity in respect of building plans passed, although activity has slowed sharply post-Covid. Meanwhile, Kempton Park and Boksburg have both more than fully recovered post-pandemic and have registered more consistent levels of activity.
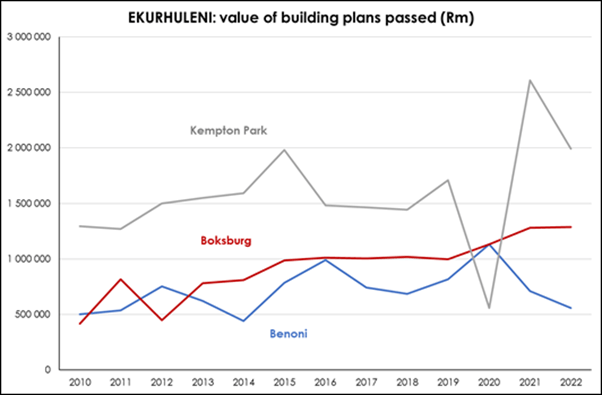
“When tracking the value of building plans passed in Ekurhuleni, despite being hard hit by Covid, Kempton Park is clearly the dominant metro in terms of the value of plans passed and has also experienced a robust post-Covid recovery. Boksburg has seen a slow but steady increase in the value of plans passed, while the surge in the number of plans passed in Benoni has not translated to a spike in the value of plans passed, which may be attributable to more affordable housing,” concludes Dr Golding.